Transactions Per Document Type
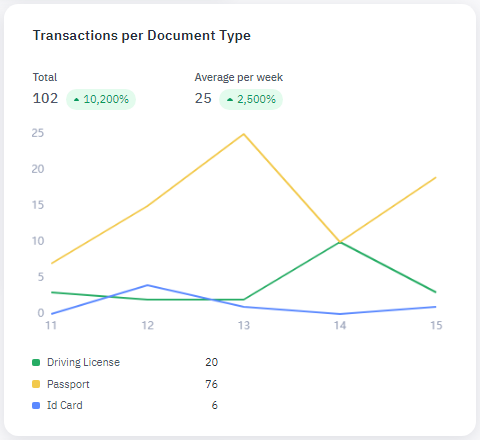
The Transactions per Document Type widget shows the following data:
-
Total: Total number of transactions
 An executed business process that is associated with an account. The transaction applies credentials for the account to a workflow and contains the decision rendered by the workflow. processed during the selected time frame that included some type of document, along with the percentage change over the same time period of the previous year.
 -
Avg per day/week/month: Average number of transactions processed per day, week, or month, that included some type of document, along with the percentage change over the same time period of the previous year.
The line graph is color-coded to show the number of transactions over time involving each type of document. At the bottom of the graph are the number of transactions for the selected time frame broken down by document type.
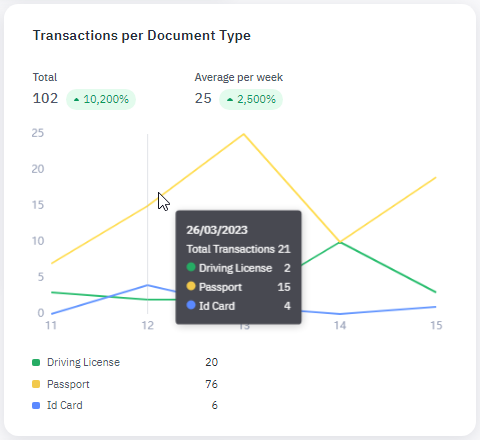
Hover your pointer over the graph to view the numbers broken down by a single day, week, or month.

